Data Literacy is HOT at Minneanalytics Data Tech 2019

For people on the technology side of analytics and data science, there can often be a sense of frustration that the business teams don’t fully understand how to use the data, models, insights, and reports that we create for them. Business teams need to DO SOMETHING with the data, or you won’t see the ROI on your analytics projects.

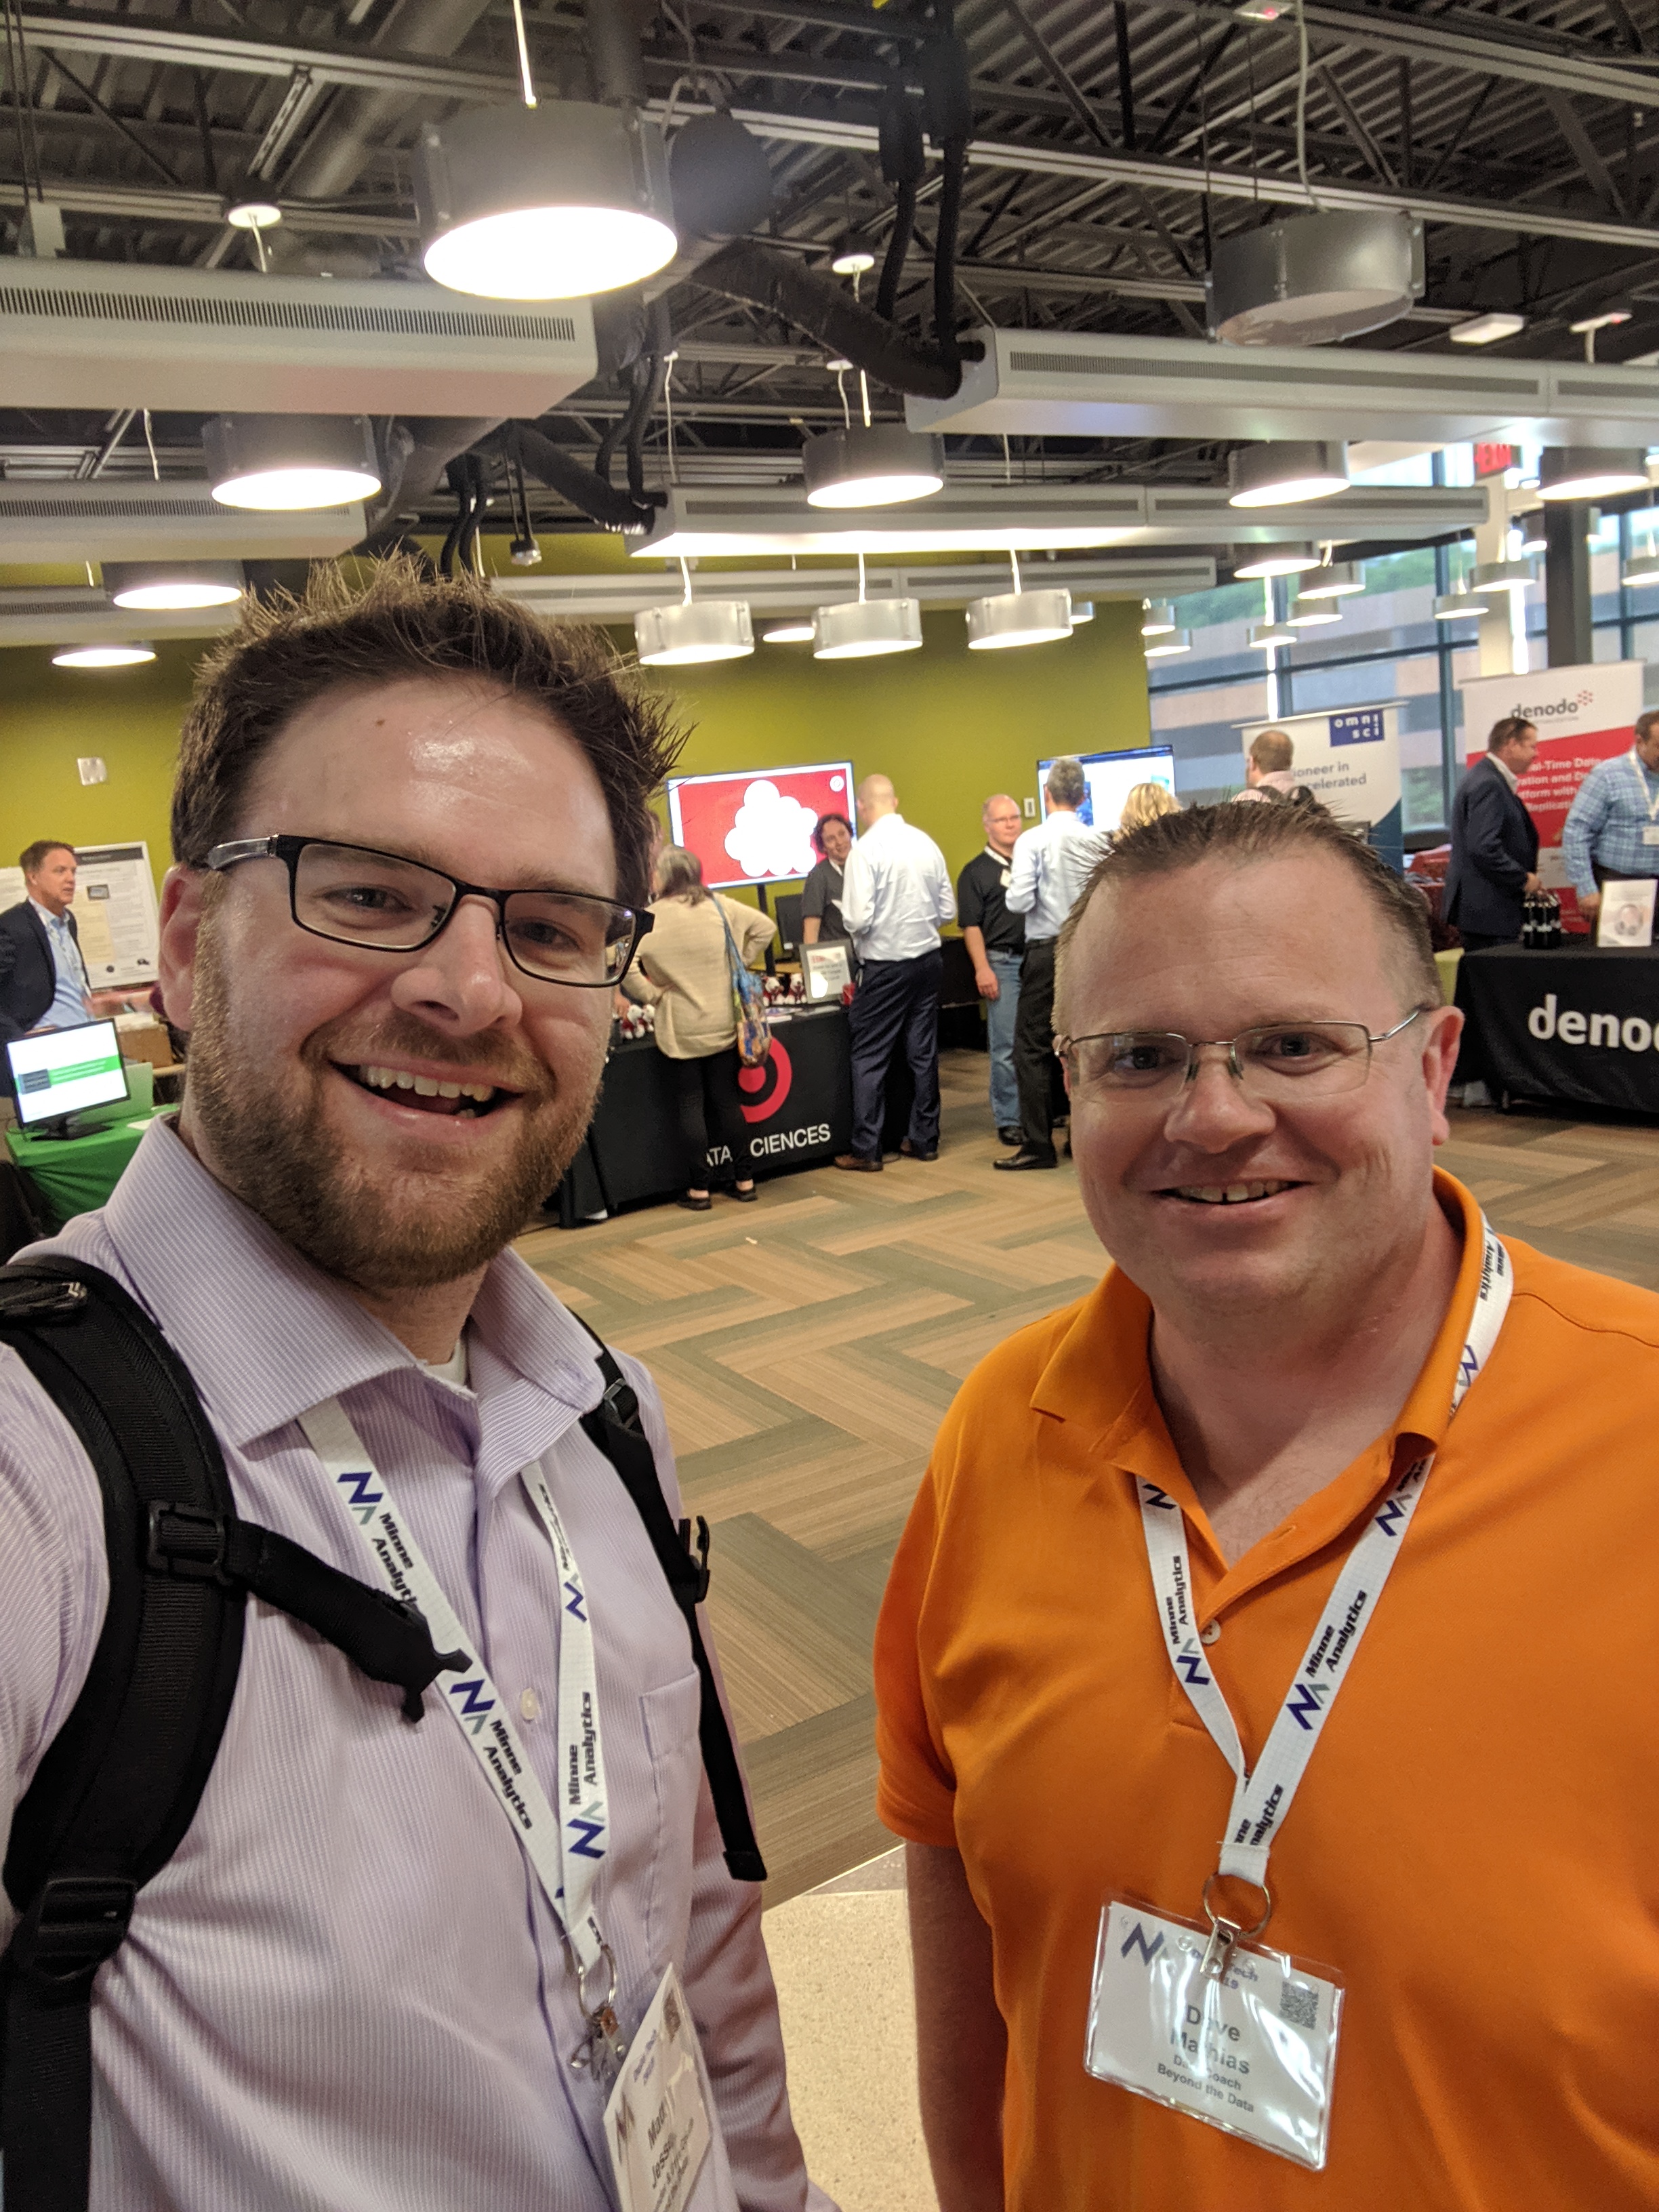
Matt and Dave checking out the vendor hall at Minneanalytics Data Tech 2019

Matt and Dave checking out the vendor hall at Minneanalytics Data Tech 2019

Matt and I had the opportunity to speak about exactly this topic at the 5th Annual MinneAnalytics Data Tech 2019 conference in the Twin Cities last week. The conference was buzzing with energy this year, with over 1,300 people registered!

We were interested to see how a Data Literacy topic would be received at a conference designed for Data Science and Information Tech people. It turns out that both business and technical people are interested in improving the fundamental data capabilities of their organizations, as 200 people signed up for the event!

Our key message was simple: If you’re an analyst or data scientist, and feel like the business team doesn’t quite “get” what you’re doing… start building relationships with them! Data Literacy for your business teams start with you. They know that data can help them, but you need to bring them along the journey.

To that end, here are our three ideas for Data Science, Analytics and BI teams to start dipping their toes in the water of data literacy for their organization:

  1. Find a business buddy. Get at least one and more preferably business buddies where you can share your knowledge around the power of data literacy. In turn you can get more knowledge around the business domain. Seek out people that are in a similar stage in their career but on business side. important: This is different than and not a mentor relationship.

  2. Do a data viz challenge or hackathon together. Working on the same team in a close time-boxed competitive environment with those that are business-side people will help you empathize and respect them more with them and vice versa. Remember we talk about diversity and it's strength and an element of diverse teams is different organizational backgrounds.

  3. Judge a student data challenge together. There are a lot of student analytics challenges nowadays and they are always looking for judges. Find one and get your business buddy or another business-side person to participate in this challenge as a judge. You will both be better able to understand more of your strengths from the questions you each ask and engagement with student teams. Plus you will be doing a social good by doing this and better helping these students understand different perspectives from an organization.

Thank you MinneAnalytics, their sponsors, and everyone that attended Data Tech 2019 and especially those attending our session. We love coming to these events to see just how powerful a community’s passion around data can be.

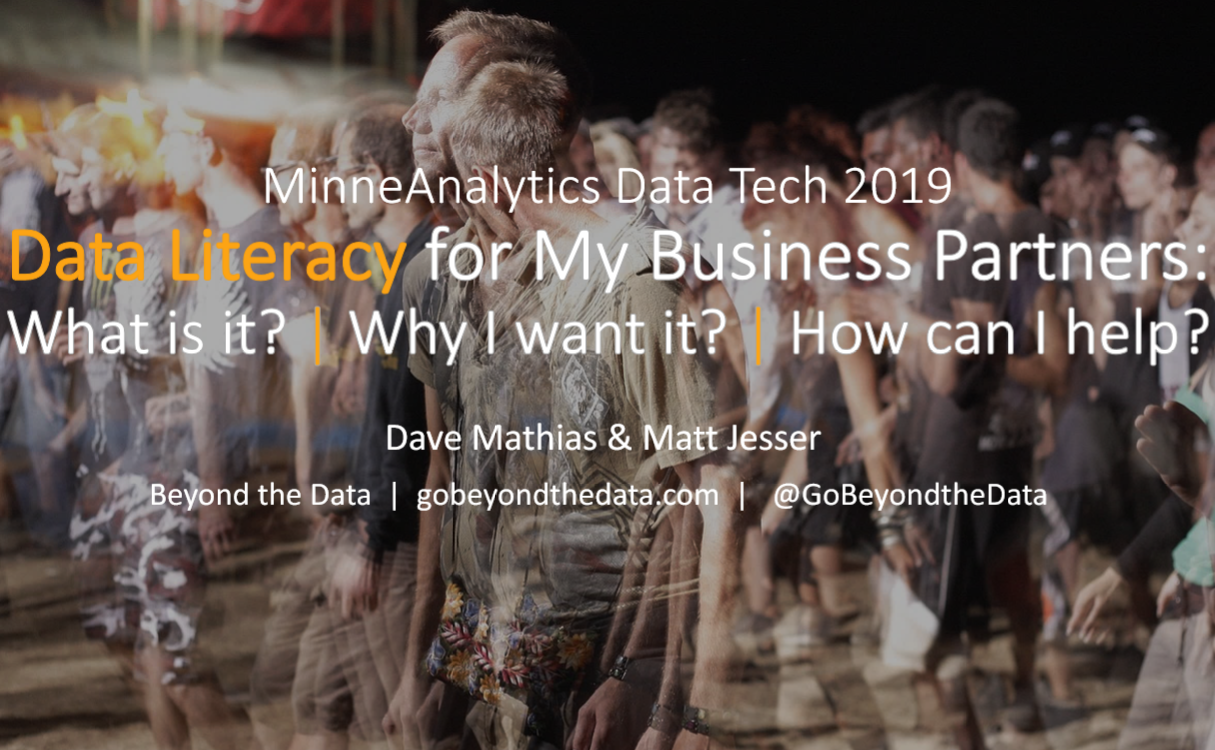
Download the presentation

Data Literacy Presentation Data Tech 2019.png


Improving Higher Education Through Data with David Niemi

Listen to the Episode

Subscribe to the Podcast

Episode Summary

David Niemi loves higher education. So much so that he’s spent his entire career involved in it. From an early age, David recognized that there were better ways to help students and learners achieve their goals, and he’s been on a mission to make that experience better ever since. Throughout his career, he’s been a teacher, student, EdTech leader, professor, and analyst. David perfectly straddles the line between technology, data science and education, which makes him well suited for leading Kaplan’s Learning Analytics division, as the VP of Measurement and Evaluation.

If a picture is worth a thousand words, then a data visualization must be worth far more than that - Dave Mathias

EdTech has come a long way in the last 20 years. But even today, David believes there’s lots of opportunity to do it better. He starts with a basic question: “If we actually built ed-tech that taught people something, how would we know if they’re actually learning anything?”

This is the foundation for David’s role at Kaplan. He’s looking past “completion rates” and “GPA” and looking at measuring the real skills that are transferred to the students. He’s focused on the learner outcomes, like getting a job, increasing their salary, and improving their lives and communities.

So what are the key metrics or questions should Higher Ed be focusing on? David boils it down to three easy points: Are the students learning something? What is the level of student engagement during the course? What are the measures of student motivation throughout the course? These are different than the typical metrics because they are collected in near-real-time and provide teachers with tailored feedback on each student that ensures they’re getting the right level of instruction at the right time.

A measure of learning should tell you what new skills, knowledge, ideas and concepts have you developed. Not how many courses you completed.
— David Niemi

David also shared some interesting correlations between how to successfully educate learners and how to run successful analytics projects. In both cases, you need start with the end in mind… For education, it’s

1) what do you want to do in your career?

2) What skills do you need to get there?

3) Which classes or programs will provide those skills?

This is exactly how analytics projects should work!

1) What does the business need to solve?

2) What data do we need to inform those decisions?

3) What techniques do we use to tease the answers out of the data?

We also talked a bit about David’s new book, Learning Analytics in Education which is a set of research studies focused on pairing education data with data science techniques to drive better engagement for students, whether in online classes or in-person.

The book is one of the first to look at these new EdTech platforms that allow for ongoing measurements of student progress. They investigate how they can use these new data points to help educators increase their students’ success. These educators can now harness data to personalize the experiences for learners, while improving overall outcomes at scale.

If you’re at all interested in this brand new space, we strongly encourage you to pick up a copy!

And thanks to David for coming on the show!

david-niemi-lae-book-cover.jpg

More about David

Check out David’s book on Amazon: Learning Analytics in Education

Connect with David on LinkedIn: in/david-niemi-2630757

Follow Kaplan on Twitter: @KaplanNews


Stories from the Data Trenches with Liz Weber and Tessa Enns

Listen to the Episode

Subscribe to the Podcast

Episode Summary

Back in December, Dave and I had the privilege of doing a speaking event at the MinneFRAMA (Finance, Retail, Marketing Analytics) event. Naturally, we decided to try something different and tape a live episode with two of my favorite analytics professionals in the Twin Cities, Tessa Enns and Liz Weber.

It was truly a once-in-a-lifetime experience: Sipping coffee, and talking analytics with these two amazing women. The venue didn’t hurt either! We were in a huge room at the Minnesota Science Museum, with our backs against a wall of windows overlooking the Mississippi river. We learned a lot about how to make sure your analytics projects are truly successful.

Tessa Enns

If a picture is worth a thousand words, then a data visualization must be worth far more than that - Dave Mathias
I’m not working to fuel my technical skills, my technical skills are working to fuel the business challenges
— Tessa Enns

Tessa talked to us about “accidentally” coming into an analyst role at Cargill, being given a huge transportation dataset and being tasked with finding something in it. Tessa is the kind of amazing person who looked at this as an opportunity, and went right to work, learning the data, learning the business, and learning technical skills along the way.

What is so amazing about her journey is that she was able to build a strong relationship with the business, who now trust the data, find opportunities to improve, and know how to turn the numbers into action that drives real monetary value.

Tessa preaches an approach where analysts need to “lead with the needs, not with the data”. She says this helps the analyst understand the real problem and help solve it. She also recommends putting every insight into dollar terms that your business will understand. “I put the cost savings or cost impacts right at the top of every dashboard”.

Liz Weber

Liz.jpg
Take some time to understand the business processes that create your data. You will be able to understand your business teams and tell better stories that drive change
— Liz Weber

Liz talked to us about a highly complex pricing challenge that her VP faced a number of years ago. The team was going through a major transition, and had invested a huge amount of money in their business. The VP wanted a dashboard to start monitoring whether this transformation was going successfully.

Liz started with the end in mind. Learn about what the leader wants, where they’re trying to go, and what the key measures of success really look like. She then sat down with the IT team, and the business teams underneath this VP. Making sure that everyone had a voice in the project was mission-critical to make sure that she 1) had the right resources, 2) had everyone moving in the same direction, 3) made the solution better than just her own ideas. It also helped with adoption, and making sure that everyone actually USED the end product.

What she learned from this project was that your leader/sponsor matters. If you don’t have the right sponsorship, it doesn’t matter how smart you are, or what kinds of technical knowledge you possess. You need to make sure you’re aligned to leaders who are committed to doing something with the outputs you produce.

Resources & Links


We Deserve a Better Paradigm for Professional Education

We Deserve a New Paradigm For Professional Education

Providing new and innovative ways to deliver data training is one of the founding tenets of Beyond the Data

Providing new and innovative ways to deliver data training is one of the founding tenets of Beyond the Data

Higher education is in need of disruption. Decade after decade it remains essentially unchanged. An educator stands up in front of students and dictates knowledge. The students’ knowledge of facts, theories, and processes with occasional application are then tested.

Worse yet education has become increasingly expensive with students investing large sums prior to truly knowing what they want to do. Then, they go off into the workplace and in land of rapidly changing environments many times those skills become obsolete.

One of the founding tenets of Beyond the Data was to find a better way to provide the RIGHT skills to the RIGHT people at the RIGHT time. Starting today, we’re re-writing the rules on professional education

The building blocks of a new education paradigm

higher-ed-money.jpg

Affordable

If this is going to work, then it needs to be affordable for both students directly and also for employers paying for employees’ education. We’ve seen the mountain of debt that students come out of school with. It can’t continue like this.


Diversity.jpg

Accessible

Students should have opportunity to learn no matter where they are in a convenient fashion. This means not having to drive long distances to stale classrooms. It can mean online classes, but it could also mean learn-at-your-own-pace type environments. Or more one-on-one scheduled mentoring sessions.


alone-bookshelves-casual-459768.jpg

Practical

If a student can’t apply the knowledge in some meaningful way RIGHT NOW, then what’s the point? Providing real problems that they are passionate about is what will create lasting skills that improve their careers. It is time to stop memorizing facts and to stop thinking in theoreticals.


adults-collaborate-collaboration-1036641.jpg

Continual

Learning doesn’t stop when you leave the classroom. In fact, it might not START when you enter the classroom. Learning takes time and requires doing, seeing, experiencing, and discussing. That’s why the lessons should be long-lasting, with the content always available to come back to… months or even years later.


adults-brainstorming-business-1595385.jpg

Communal

This might be the most important part. Learning happens in a shared space with others. When communities are created, ideas are shared, relationships are built and we become better with these people than we ever could have without. They push us to think differently, to reach beyond our limits. Community is the secret sauce that makes learning work.

- Dave Mathias

Follow me on LinkedIn


Beyond the Data Attends MinneFRAMA 2018

Today, we’re discussing Dave and Matt’s experience at MinneFRAMA 2018, hosted by the always wonderful, MinneAnalytics.

IMG_1014.JPG

Dave:

So Matt, we were fortunate enough to attend and actively participate in MinneFRAMA 2018 this year. The event was geared towards financial, retail, and marketing analytics, and people across the Twin Cities showed up in droves!

Matt:

Yes! This was the first event that MinneAnalytics has hosted in St. Paul and it did not disappoint. The Science Museum of MN hosted us and it was a great location.

Dave:

There’s just something about walking into an analytics conference and being greeted by a life-size T-Rex that gets you in the mood for some data crunching.

Matt:

I’m not sure it made me want to crunch numbers, but it definitely made me want to record an episode of the Data Able podcast! What an amazing view we had while we sipped our morning coffee and discussed the finer points of using data effectively.

Dave:

We were lucky enough to have Tessa Enns and Liz Weber join our show, live. They were such gracious guests. I wish we could have talked longer with them. We should probably move along with our Top 10 list from the event, huh?

Matt:

Yes we should. Since you spoke at three different sessions, why don’t you relax a bit and let me run with this one. Without further ado…

Beyond the Data’s Top 10 List from MinneFRAMA 2018

  1. The Science Museum of Minnesota was a hit.

    Tons of great conversations that were helped by the fantastic space. We made music all day by ascending and descending the musical stairs. Plus, it was a huge bonus to get a free ticket to a future Science Museum visit!

  2. AI was all the buzz.

    The hype is strong with AI at MinneFRAMA this year. However, the applications went deep, including discussions from the future of work, augmenting attorneys, and even AI to monitor AI.

  3. The Future of data privacy regulation is uncertain, but direction is not.

    With Europe's General Data Protection Regulation (GDPR) and the California Consumer Privacy Act in place, the general view is this only the start. Good discussion around data privacy and its present and future with Melissa Krasnow moderating a panel of experts, Tim Nagle, Erich Axmacher, and Brad Hammer.

  4. Data storytelling and viz is in high demand. 

    The importance of data visualization and storytelling was a popular theme. Arlene Birt's Visual Storytelling: Putting Data into Context session was a hit and great turnout for the TC Data Viz MeetUp with an engaged audience right after lunch.

  5. Not everyone needs a screen and slides.

    This is the first time where MinneAnalytics had a room that was designed to not have a screen! Lots of great sessions were held in an informal setting at the Elements Café, overlooking the Mississippi river. Great job by Josh Moe and Morgan Catlin using a whiteboard to tell their story. We also saw post-it notes and pinned print outs!

  6. Sharing a meal with She Talks Data.

    The wonderful She Talks Data MeetUp held a networking session over lunch. Packed from the start, it was a popular destination. Thank you to Serena Roberts and Laura Madsen for continuing to advocate for women in data!

  7. Startups abound.

    We had more startups participate in the MinneFRAMA Startup Showcase than any of our prior events. Analytics knows no company size boundaries and is often used by startups as their disruptor.

  8. Getting technical.

    While Data Tech is MinneAnalytics most technical event, MinneFRAMA had many great technical sessions starting off with sessions like Joe Konstan, PhD and ending with Jason McNellis. Like all MinneAnalytics events the goal is to provide a variety of options.

  9. Standing room only.

    While I can't speak to all the sessions, Jason Rogowski and Ryan Stellmaker's session around Building Marketing Analytics Capabilities, Brick by Brick was the likely winner for biggest audience - standing room only in the Omni Theater. Impressive Jason and Ryan!

  10. Live podcast taping to kick things off.

    Last year we had Kyle Polich record an interview with Joe Konstan, PhD on Data Skeptic at FARCON, this year we got to interview Liz Weber and Tessa Enns on the Data Able podcast. Liz and Tessa told some great stories about successful analytics projects. Make sure to subscribe to Data Able on your favorite podcast catcher and listen to the MinneFRAMA taping when it’s released. 

So what is our big takeaway from all of this? It’s all about community!

While sessions were often full, there were many hallway conversations both between and during sessions. Tons of engagement with people making new connections and re-invigorating old connections. There was even a mini-job fair where recruiters were talking with interested persons. And of course, the day ended with good beer, good wine, and good conversations.

All in all, we had another stellar MinneAnalytics event thanks to the presenters, sponsors, and most importantly the attendees.

Until next year!