Ep 28 - Rachel Stuve - Fusing People with Data

Listen to the Episode

Subscribe to the Podcast

Episode Summary

I can teach someone how to code or use visualization tools. But I can’t teach someone to be inquisitive and to solve a problem. The human side of data is so important.
— Rachel Stuve
Caroline Doye

The reality of data and analytics today, is that it’s not really about the data or analytics at all. It’s about the human behavior. The choices that executives and leaders make. It’s about augmenting those daily decisions to make them slightly better than if they didn’t have data. Over time, these add up to immense value.

Many analytics teams still focus on the data engineering. The data pipelines. The BI tools to use. Data governance and access to data are undoubtedly important, but it is all for nought if the human on the other side of the dashboard can’t or won’t do something about it.

That’s why I’m so excited to have people like Rachel Stuve in our industry. Rachel believes that data empowers humans: it's what gives us the ability to solve problems and change the world. With data, she believes that unlocking the true power comes from combining the human with that data.

So what does a data informed organization look like?

From what Rachel has found working with organizations large and small, these would be the steps:

  1. They would start with their business goals

  2. They would break down their goals into sub-goals

  3. What are the business questions or challenges that are keeping you from those sub-goals

  4. Link your data to those questions and challenges.

  5. Write the data pipelines, models, code, reports, dashboards and communicate

The key to all of this is that the analytics people are embedded directly in the business, linking data to the business objectives and driving value on the business’ terms.

We couldn’t agree more! Adding value starts with tightly aligned goals. Thanks for coming on the show and sharing your thoughts, Rachel!

More about Rachel

Links from the episode


When Technology and Creativity Collide - EYEO

Last week I (Dave) had the opportunity to be back at one of my conferences, the Eyeo Festival. What makes Eyeo Festival great is it brings together people from all over the world around art, creativity, technology, data, and social impact. You get discussions around science, machine learning, social justice, art, data visualization, and more and many of the sessions cross multiple disciplines.

One of the key takeaways for me was learning to create better spaces and communities around us. The cross-discipline nature of an event like this opens up so many avenues to creatively address business and social challenges, and in turn makes it easier for people to harness the power of data.

IMG_20190604_214132594.jpg

To give you a sense of just how diverse an event like this can be, here are some examples of the people I met and the conversations I had…

A person came by my table saying he needed our input on visualization. We chatted for a bit, discussing the challenge he was having, without realizing we were talking to famous Bre Pettis, who co-founded MakerBot, a fantastic company that pioneered affordable 3-D printing! Such a cool opportunity to kick around ideas with amazing and talented people!

IMG_20190604_205348898.jpg

I had to laugh when we got into a fascinating discussion on better transportation approaches in large cities. Turns out we were talking with employees from both Google and Uber!

This night is just an example of the excitement Eyeo can bring or really any event where you bring diverse, creatives, and technologists together that have a shared mission.

Needless to say there was no shortage of knowledge being shared and absorbed. Eyeo is a reminder for me that I can never stop learning and sharing. The world is always changing and the challenges are always developing where we can play a small part. Find a way to share something with others and always a way to learn something new from others.

Beyond interesting conversations, there were also great sessions to attend. While I don't like to call favorites, one session I found fascinating is Darius Kazemi discussion around the FriendCamp network that he started. FriendCamp is a “local” social network that is intentionally kept very small with only Darius and a set of friends being allowed in.

Darius encourages others to think about creating a similar type of network. This is somewhat of a natural pullback of the not-as-free-as-we-think culture we live in where our data is sold to others and privacy is challenging. He says it is about taking responsibilities of your data and something we should be doing no matter at home or work. If you are not aware of your data, who has access to it and how, and what it is being used for then don't expect anyone else will treat it any better.

While I certainly agree with some of Darius's premises, I also realize not everyone is going to maintain a social network server and rigorously identify and maintain their private social network.

Thank you everyone that came to #Eyeo2019 and the entire team that puts it on because this event is really inspirational. Hope to see you at #Eyeo2020 back in the Twin Cities.

Quick side note: During Eyeo I had the chance to record Data Able podcast episodes with both Nadieh Bremer and Catherine D'Ignazio. Nadieh and Catherine are both phenomenal people putting out great work into the world and sharing information. Make sure to check out their work and subscribe to the go Beyond the Data podcast so you don’t miss their episodes when they drop later this summer. 

IMG_20190606_103017238_HDR.jpg
IMG_20190606_165610761_HDR.jpg
 

- Dave Mathias

Follow me on LinkedIn


Ep 27 - How Caroline & Sara are building a huge dataviz community in Portugal

Listen to the Episode

Subscribe to the Podcast

Episode Summary

A lot of people know about data visualization, but they don’t actually understand the possibilities that can be unlocked
— Sara Mesquita

Something must be in the water in Lisbon, Portugal… Because Data visualization is on FIRE there! Dave got to attend one of their meetups when he was visiting this spring, and two of their leaders really impressed. Sara Mesquita and Caroline Doye lead this awesome group of information designers, meeting almost weekly on different topics from D3.js to Tableau.

 
Caroline Doye

Caroline Doye


For Caroline and Sara, they believe that knowing how to extract the information that is "hidden" in the data is what makes all the difference, regardless of your occupation.

The keys to their success are numerous, but something they really focus on is keeping the topics strongly interdisciplinary. They also make sure you walk away with tangible ideas to level up your skills with any tool, from Excel to Tableau or Power BI. Or if you wish to get to the next level using R, Python or even D3.js, this will be at the meetup for you as well.

Community is the key, whether it’s in the United States or in Portugal. It’s useful no matter what level you are. For the dataviz experts, giving back to the community is a way to test and hone their skills. For beginners, it’s a safe environment for people to learn, grow and try new techniques before taking back to a professional setting.

Sara Mesquita

Sara Mesquita

One of the activities that they do that I found fascinating was “data sketching”… putting ideas on paper and trying lots of iterations. Caroline feels that data sketching helps get you beyond just the coding and numbers, but really think about the ideas and try new things.

I think Dave and Matt will be doing some data sketching of our own in the near future!

More about Sara and Caroline


Data Literacy is HOT at Minneanalytics Data Tech 2019

For people on the technology side of analytics and data science, there can often be a sense of frustration that the business teams don’t fully understand how to use the data, models, insights, and reports that we create for them. Business teams need to DO SOMETHING with the data, or you won’t see the ROI on your analytics projects.

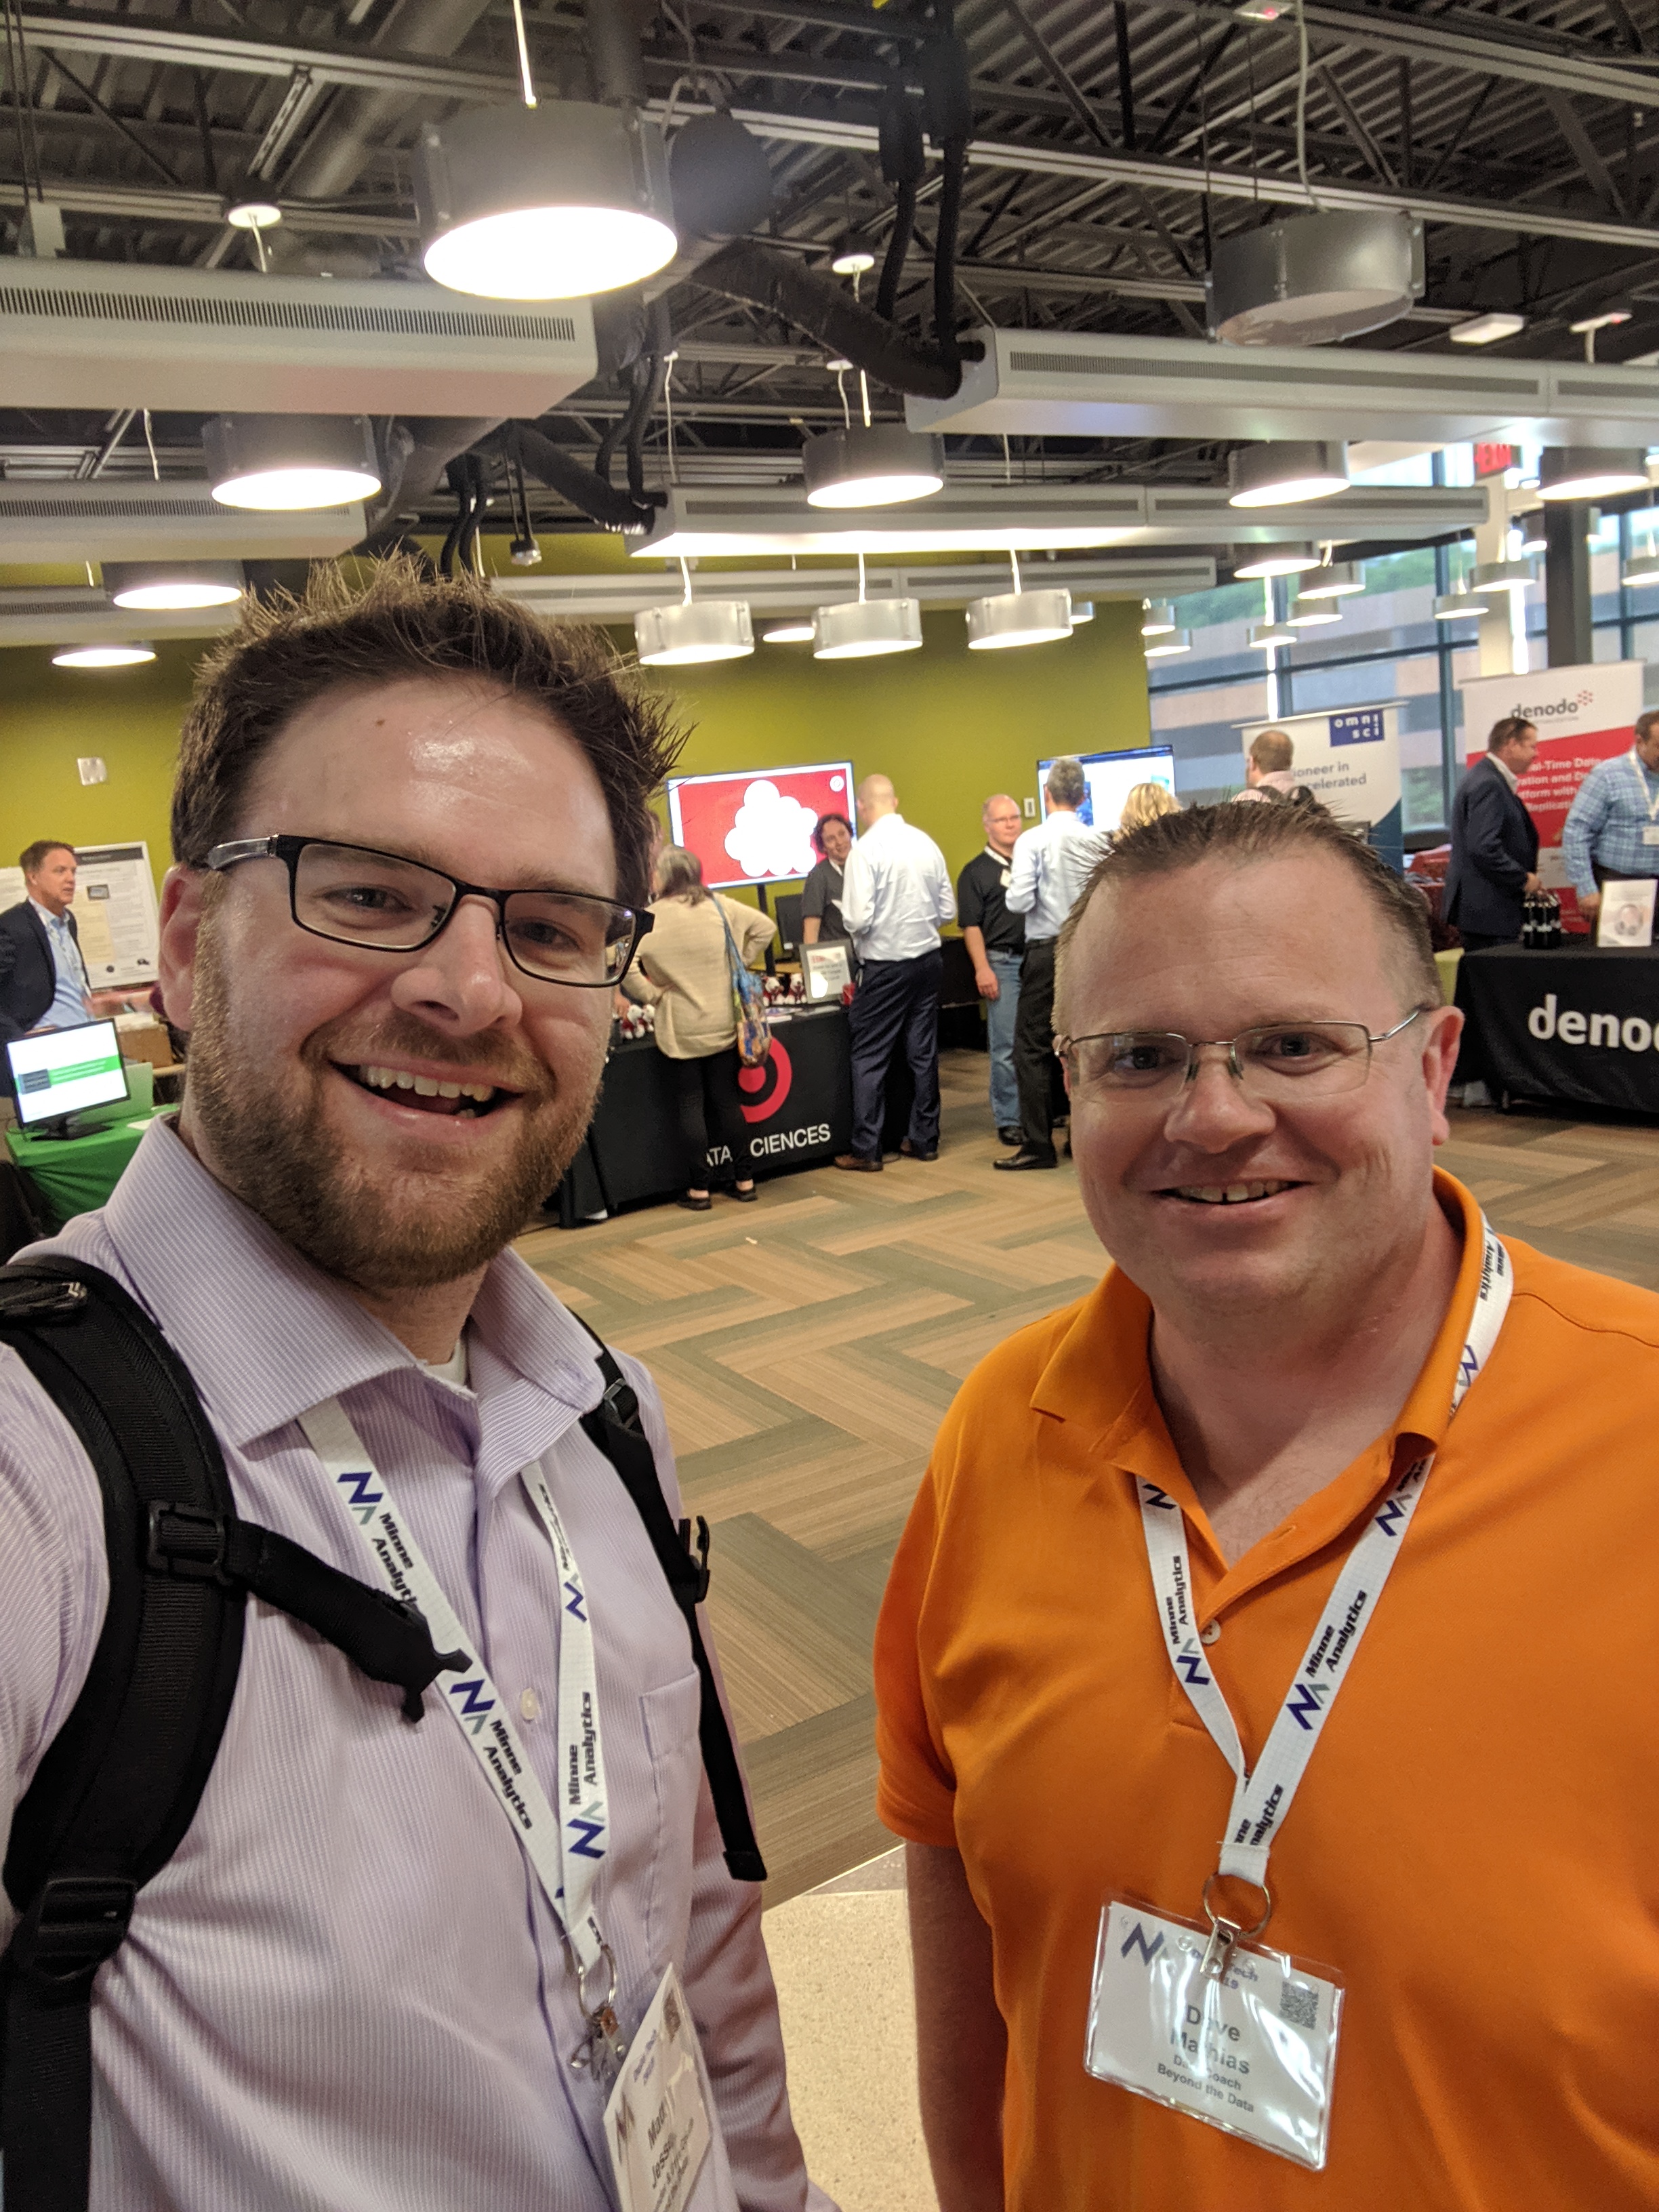
Matt and Dave checking out the vendor hall at Minneanalytics Data Tech 2019

Matt and Dave checking out the vendor hall at Minneanalytics Data Tech 2019

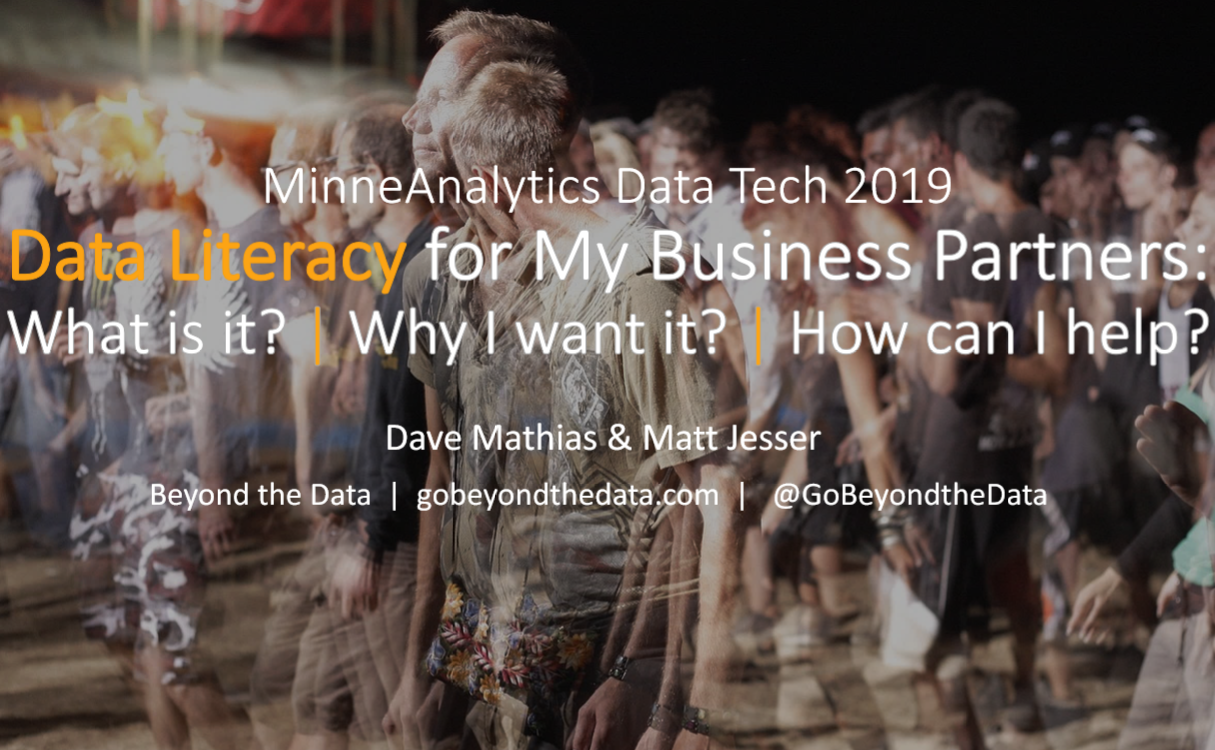
Matt and I had the opportunity to speak about exactly this topic at the 5th Annual MinneAnalytics Data Tech 2019 conference in the Twin Cities last week. The conference was buzzing with energy this year, with over 1,300 people registered!

We were interested to see how a Data Literacy topic would be received at a conference designed for Data Science and Information Tech people. It turns out that both business and technical people are interested in improving the fundamental data capabilities of their organizations, as 200 people signed up for the event!

Our key message was simple: If you’re an analyst or data scientist, and feel like the business team doesn’t quite “get” what you’re doing… start building relationships with them! Data Literacy for your business teams start with you. They know that data can help them, but you need to bring them along the journey.

To that end, here are our three ideas for Data Science, Analytics and BI teams to start dipping their toes in the water of data literacy for their organization:

  1. Find a business buddy. Get at least one and more preferably business buddies where you can share your knowledge around the power of data literacy. In turn you can get more knowledge around the business domain. Seek out people that are in a similar stage in their career but on business side. important: This is different than and not a mentor relationship.

  2. Do a data viz challenge or hackathon together. Working on the same team in a close time-boxed competitive environment with those that are business-side people will help you empathize and respect them more with them and vice versa. Remember we talk about diversity and it's strength and an element of diverse teams is different organizational backgrounds.

  3. Judge a student data challenge together. There are a lot of student analytics challenges nowadays and they are always looking for judges. Find one and get your business buddy or another business-side person to participate in this challenge as a judge. You will both be better able to understand more of your strengths from the questions you each ask and engagement with student teams. Plus you will be doing a social good by doing this and better helping these students understand different perspectives from an organization.

Thank you MinneAnalytics, their sponsors, and everyone that attended Data Tech 2019 and especially those attending our session. We love coming to these events to see just how powerful a community’s passion around data can be.

Download the presentation

Data Literacy Presentation Data Tech 2019.png


Ep 25 - Brian O'Neill - Designing Better Experiences in Analytics

Listen to the Episode

Subscribe to the Podcast

Episode Summary

Good analytics really starts with empathy. It’s truly the heart of good design. It’s caring and having the right conversations with the right people.
— Brian O'Neill

Design. User Experience. Knowing your audience. Empathizing with your end user.

These are such critical facets of getting analytics right in your organization. If you don’t pay attention to what your constituents want and need, you’ll build something amazing, but it wont’ get the adoption you should. Low adoption means people aren’t using the data you worked so hard to produce.

Data visualization and data storytelling are certainly part of the answer. But it’s only part. A well crafted data viz tells a story, but if nobody wants to read it, then was it really a good viz in the first place?

La

Brian O'Neill knows a little bit about this problem. He is a product designer and founder of the consultancy, Designing for Analytics, which provides design and UX consulting for custom enterprise data products and apps. For over 20 years, he has worked with companies including DELL/EMC, Tripadvisor, Fidelity, NetApp, MITRE, JP Morgan Chase, ETrade and numerous SAAS startups. Today Brian focuses on helping clients create more useful, usable, profitable, and engaging decision support software and information products. In addition to consulting, Brian is also an international speaker and podcast guest, having appeared at multiple O'Reilly Strata conferences, Predictive Analytics World in Berlin, and on the IBM Analytics podcast, Making Data Simple. He also authored the Designing for Analytics Self-Assessment Guide for Non-Designers,  maintains an active mailing list, and hosts the podcast, Experiencing Data. Earlier in 2018, Brian joined the International Institute for Analytics' Expert Network as an advisor on design and UX.

A fun fact about Brian? He’s a musician by training! He is a professional percussionist in Boston. He tours internationally and has performed at Carnegie Hall and The Kennedy Center

More about Brian O’Neill

Connect on LinkedIn - in/brian-oneill-product-designer

Brian’s company - Designing for Analytics

Brian’s Podcast - Experiencing Data

Brian’s Twitter - @rhythmspice

Links and References

Conference - O’Reilly Strata

Conference - Enterprise Data World

Conference - IIA Analytics Symposium